Python exercises: Plotting
Contents
Python exercises: Plotting
from jupyterquiz import display_quiz
During the exercises in the dataframes module you learned how to import a dataset, and how to look at the dataframe from multiple angles. In the python lessons for this module you learned that you can use matplotlib in three different ways. From “quick-and-rigid” to “slow-but-flexible”, these are: (1) Seaborn plotting (2) Pyplot procedural plotting (3) Object-oriented plotting
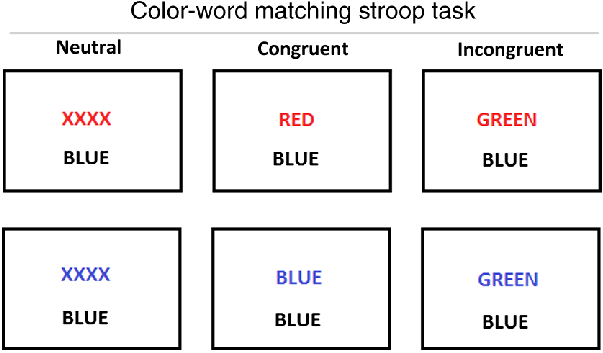
For the exercises below we will load in the same dataframe as you used in dataframe_exercises. This dataframe contains data for a Stroop task. You can try out the Stroop task for yourself here. In the dataframe, there is “congruency” column which defines which condition the trial (row) was:
“inc” stands for “incongruent” (word and color do not match)
“con” stands for “congruent” (word and color match)
“neutral” stands for trials where there was no word, but only color
See below for examples of each stimuli:
display_quiz("questions/question_1.json")
Exercise 1. Seaborn plotting
Now, using seaborn, make a bar plot of the response time of each value in ‘congruency’. Give the plot a title. Which value has the highest response times?
import pandas as pd
import seaborn as sns
import matplotlib.pyplot as plt

df = pd.read_csv('https://raw.githubusercontent.com/JeshuaT/Experimentation1/main/content/10_dataframes/data/data_exercises/subject-1_IC.csv')

# your code here
Exercise 2: Matplotlib Procedural Plotting
Now, make the same plot using the matplotlib procedural plotting approach (don’t forget to include the title as well).
# your answer here
Exercise 3: Matplotlib Object-Oriented Plotting
Yes, you guessed it: now plot the same plot using the object-oriented approach (again, title!).
# your answer here