Python lessons: Plotting
Python lessons: Plotting
from IPython.display import IFrame
This module is all about making visualizations. We will use the python package matplotlib for our visualizations, but before we dive in it’s important to get a high-level feel for how matplotlib is built:
IFrame(src="https://www.youtube.com/embed/IlKvEWXajJM", width="560", height="315")
Let’s now dive deeper into this difference between procedural programming (state machine mode) and the object-oriented programming mode (figures and axes). If you prefer, here you can read along with the jupyter notebook the author is discussing
IFrame(src="https://www.youtube.com/embed/w6KUTf70avw", width="560", height="315")
In this course we will focus on the object-oriented programming way of using matplotlib, but we will showcase each approach since you will see all of them used in examples on the internet. However, the object-oriented approach is what matplotlib recommends beginners to start with. Initially it may seem like more work for your simple plots, but soon enough you will need the object-oriented programming, and therefore it’s the best basis to build your matplotlib skills on. The next tutorial video is all about this object-oriented matplotlib programming (again, here is the accompanying notebook):
IFrame(src="https://www.youtube.com/embed/sVekwr8t7jw", width="560", height="315")
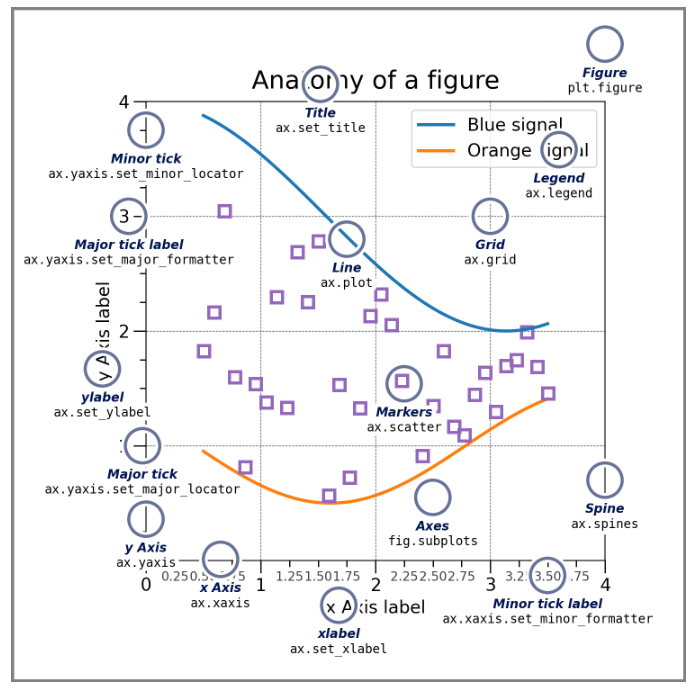
Alright, now you have a good high-level understanding of matplotlib. A good reference page is this quick start guide by the developers of matplotlib. Especially the overview below (which is taken from the quick start guide) is very useful to keep close when you go through this module.